


uschools/E+ via Getty Images
On Wednesday, April 13, the total amount of reverse repurchase agreements on the balance sheet of the Federal Reserve hit an all-time high of $2,070.3 billion.
Reverse repurchase agreements, or, reverse repos, represent sales of securities held by the Federal Reserve under an agreement to repurchase them after a very short period of time.
Reverse repos remove reserves from the banking system and offset any purchases of securities, outright, that the Fed adds to its assets.
In a real sense, when the Fed buys securities, it adds reserves to the banking system.
When the Fed sells securities, it removes reserves from the banking system.
Over the past year, the Federal Reserve has been very active in the use of reverse repos.
In April, we notice that reverse repos began to rise modestly, rising from around $200.0 billion in the first quarter of 2021. On March 31, reverse repos on the Fed’s balance sheet had risen to about $350.0 billion.
The Fed entered into more and more repurchase agreements following that date.
After September 1, 2021, we find that reverse repos really grew on the Fed’s balance sheet.
Note the growth in the following chart.
Reverse Repurchase Agreements (Federal Reserve)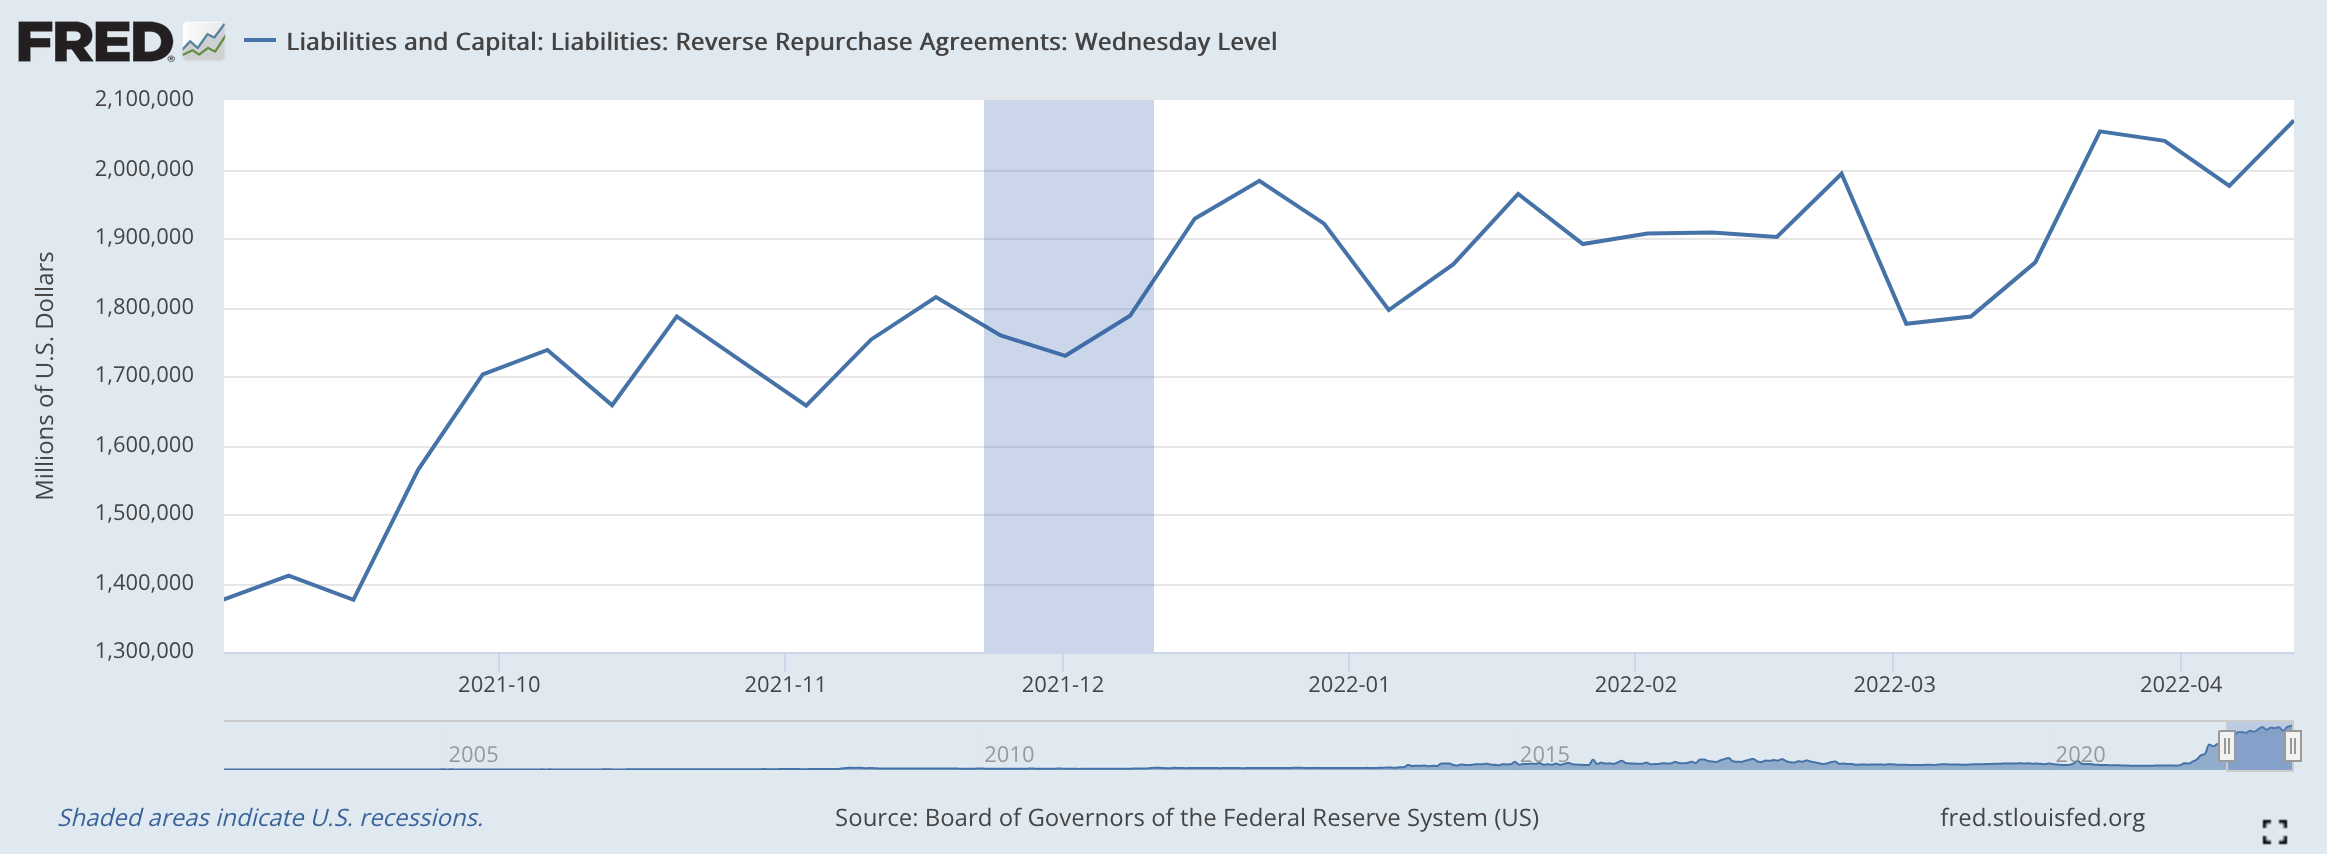
Federal Reserve Tapers Security Purchases
All through 2021, Federal Reserve officials were experiencing a growing concern with the rising rate of inflation and the need for the Federal Reserve to go into a stance that would combat this threat.
During the early part of the year, the Fed was accommodating the banking system by purchasing, outright, $120.0 billion in securities to add to its balance sheet.
By the end of the summer, Federal Reserve officials had grown very concerned that its policy rate of interest would drop into negative territory.
On September 1, 2021, the Fed began to keep the effective Federal Funds rate constant at 0.08 percent. It was very successful.
Federal Funds (effective) Rate (Federal Reserve)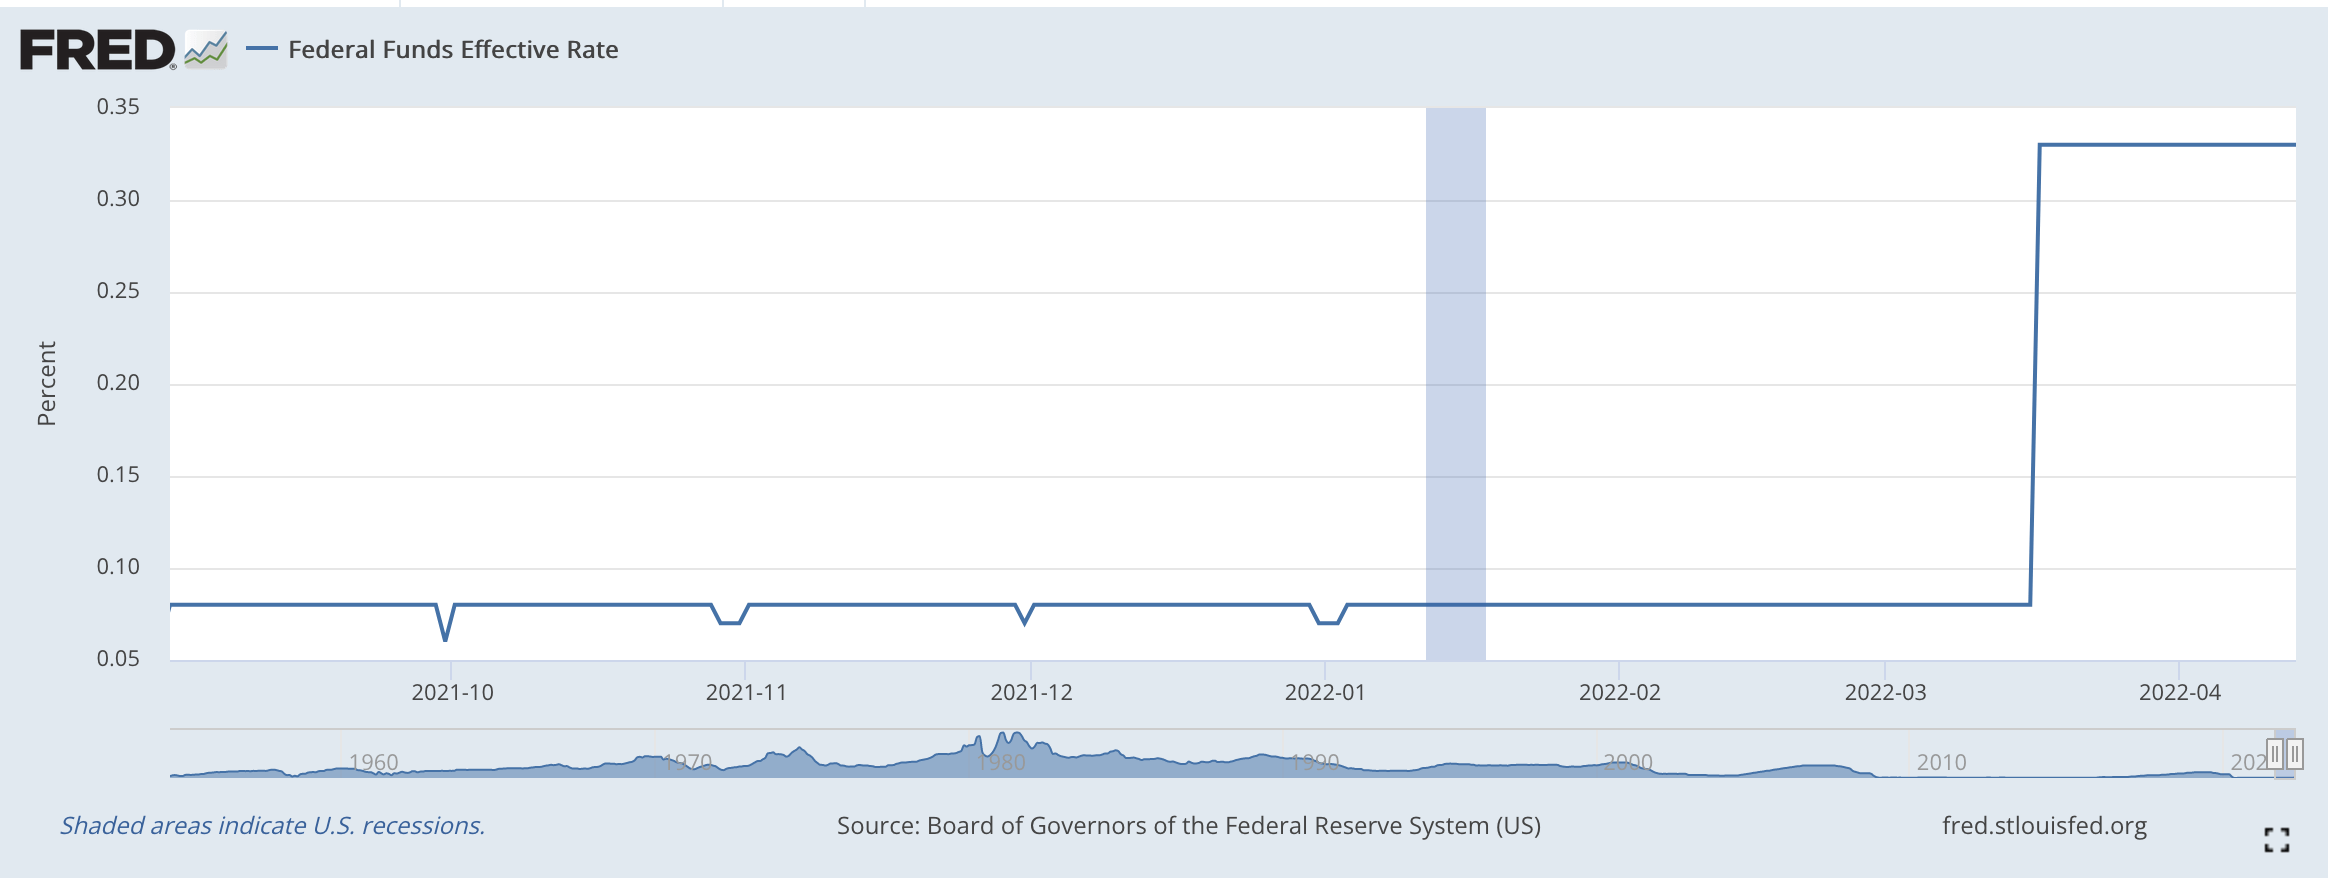
The question is, how did the Fed keep the effective Federal Funds rate so constant if it was still buying $120.0 billion of securities every month, putting more and more liquidity into the financial system.
Well, we note that the reverse repos on the Fed’s balance sheet began to rise. (Check the first chart above.)
On September 1, 2021, reverse repos on the Fed’s balance sheet totaled $1,376.3 billion. The trend, since that date, has been up. Up to the point that these repos topped $2.0 trillion on April 13, 2022.
As a consequence, commercial bank liquidity declined, which helped the Federal Reserve keep the effective Federal Funds rate positive and constant at 0.08 percent.
Reserve Balances With Federal Reserve Banks (Federal Reserve)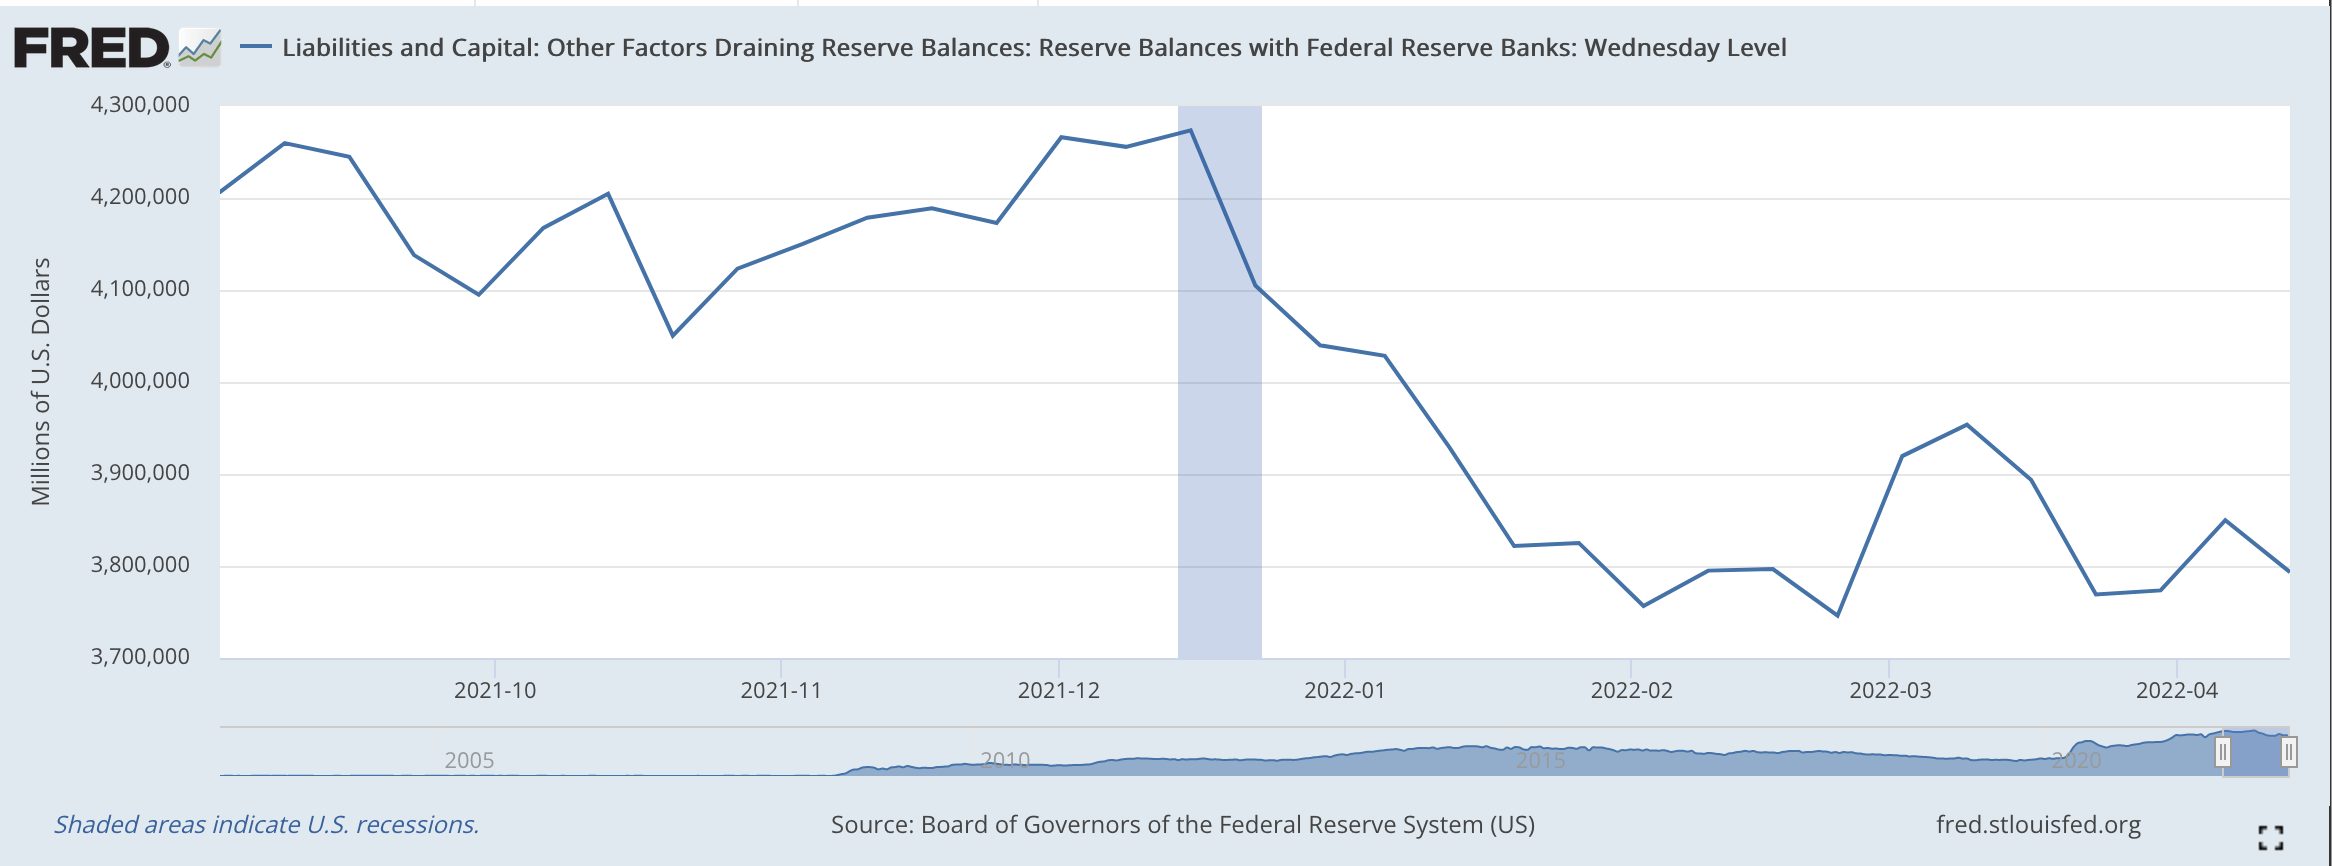
Note, however, as the Fed did begin to taper its outright purchases of securities for its portfolio, the rise in reverse repos on the balance sheet also reduced commercial bank liquidity so that it could move, in the middle of March, to actually raise its policy rate of interest, as can be seen in the second chart above.
Significant Points
In this history, there are some significant points that were achieved that should be noted.
So, first, we begin the tale on September 1, 2021, the date the Fed moved to keep its policy rate of interest constant at 0.08 percent.
On that date, the Fed carried, on its balance sheet, $1,376.3 billion in reverse repos.
On that date, the amount of reserve balances at Federal Reserve banks, a measure of the liquidity in the banking system, was at $4,206.4 billion.
The next significant date I would like to point out is the day that the price of Bitcoin (BTC-USD) hit its peak. The date was November 9, 2021. The peak price I have recorded for that date was $67,415.
On November 10, 2021, the amount of reverse repos showing up on the Fed’s balance sheet was $1,753.0 billion, almost a $400.0 billion increase from the earlier date.
Reserve balances at Federal Reserve banks had dropped to $4,178.6 billion.
The “tightening” was taking…
Read More: Federal Reserve Watch: Reverse Repurchase Agreements Hit All-Time High


